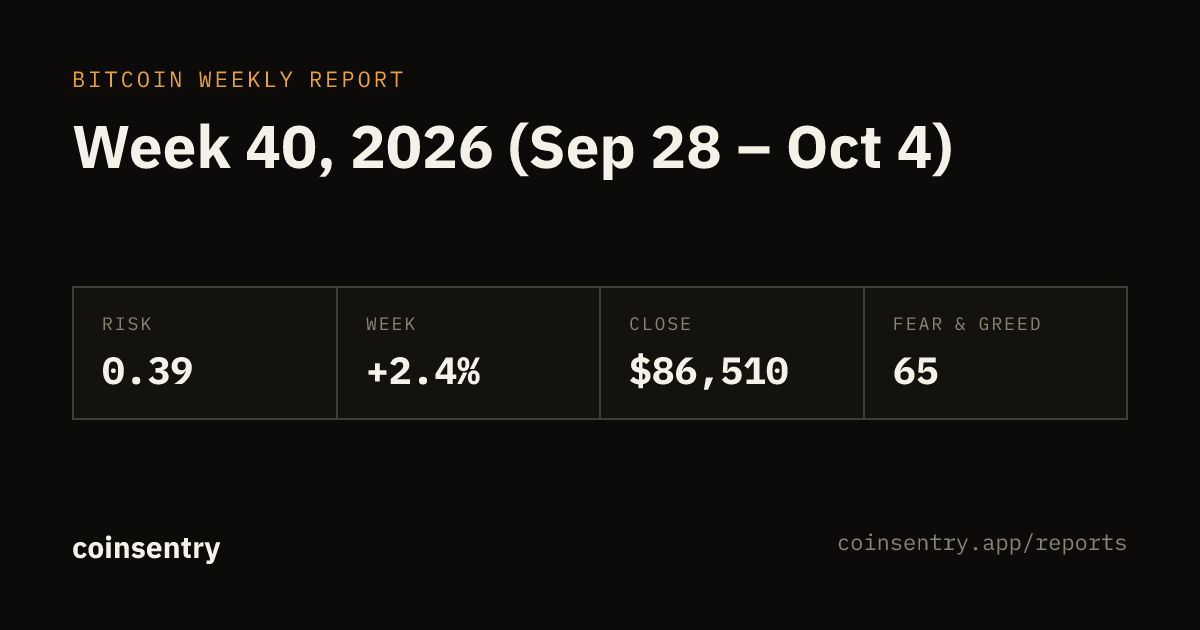
Bitcoin this week, Week 40, 2026 (Sep 28 – Oct 4)
Bitcoin risk rose from 0.37 to 0.39 (low). Price rose 2.4% to close at $86,510, with the biggest daily move +2.1% on 2026-10-04. Sentiment ended at greed (65 on the Fear & Greed Index).
FREE PLAN — NO CARDFREE PLAN — NO CARD
Risk this week
Bitcoin risk rose from 0.37 to 0.39 over the week and ends it low. Risk runs from 0 to 1: low readings have lined up with past cycle bottoms, high ones with past tops. It blends several long-term valuation signals into one number, so a single strong week rarely moves it far.
| RISK | CLOSE | DAILY CHANGE | |
|---|---|---|---|
| 2026-09-28 | 0.36 | $83,462 | -1.2% |
| 2026-09-29 | 0.36 | $83,629 | +0.2% |
| 2026-09-30 | 0.36 | $83,563 | -0.1% |
| 2026-10-01 | 0.37 | $84,853 | +1.5% |
| 2026-10-02 | 0.37 | $84,501 | -0.4% |
| 2026-10-03 | 0.37 | $84,747 | +0.3% |
| 2026-10-04 | 0.39 | $86,510 | +2.1% |
Earlier times risk sat here
The most recent earlier stretches when Bitcoin risk closed within 0.02 of this week's 0.39, and what Bitcoin's price did afterwards. These are past moves, not a forecast: the same risk level has been followed by both gains and losses.
| RISK | BTC CLOSE | 90 DAYS LATER | 1 YEAR LATER | |
|---|---|---|---|---|
| 2025-11-20 | 0.37 | $86,527 | -23.2% | Not yet |
| 2023-03-23 | 0.37 | $28,343 | +5.9% | +125.1% |
| 2022-01-21 | 0.37 | $36,496 | +10.9% | -37.6% |
| 2019-05-08 | 0.38 | $5,941 | +93.1% | +68.3% |
| 2018-06-22 | 0.39 | $6,050 | +7.3% | +76.2% |
Where the indicators ended the week
| WEEK START | WEEK END | READING | |
|---|---|---|---|
| Mayer Multiple | 1.19× | 1.21× | Above 200-day average |
| 2-Year MA Multiplier | 0.95× | 0.97× | Below 2-year average |
| 200-Week Moving Average | 1.28× | 1.31× | Above 200-week average |
| Golden Ratio Multiplier | 1.08× | 1.11× | Between 1× and 1.6× |
| Pi Cycle Top | 0.44× | 0.45× | No cross |
| Pi Cycle Bottom | 1.12× | 1.14× | No cross |
| Power Law | 0.62× | 0.63× | Below fair value |
| Rainbow Chart | Band 2 | Band 2 | Band 2 · Deep value |
| Stock-to-Flow | 0.10× | 0.10× | Below model price |
| Puell Multiple | 1.05× | 1.09× | Normal range |
| Hash Ribbons | 1.013× | 1.021× | No capitulation |
| RSI (daily) | 65.1 | 68.6 | Neutral |
| RSI (weekly) | 61.6 | 63.3 | Neutral |
| RSI (monthly) | 53.6 | 54.6 | Neutral |
| Fear & Greed Index | 70 | 65 | Greed |
The week in price
Bitcoin gained 2.4% from $84,457 to $86,510. The highest close was $86,510 on 2026-10-04, the lowest $83,462 on 2026-09-28, and the biggest daily move +2.1% on 2026-10-04. The Fear & Greed Index averaged 71 and closed at 65, greed.
Figures use daily UTC closes from Bitstamp's BTC/USD, the same series behind every chart on the indicators pages. Free to quote with a link to this page.
Use these numbers
coinsentry (2026). Bitcoin Weekly: Week 40, 2026 (Sep 28 – Oct 4). https://coinsentry.app/reports/bitcoin/2026-w40